2026 CANDIDATE

Andy Barr

U.S. Senate
RepublicanKentucky

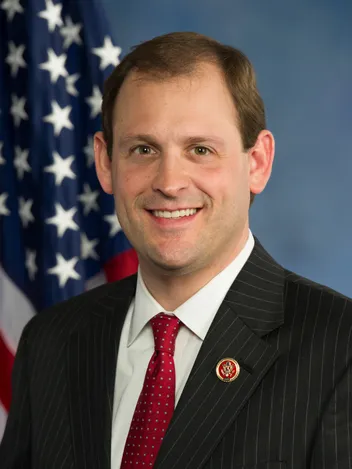
Andy Barr
Photo creditU.S. Government, “Andy Barr, official portrait, 113th Congress” (March 2012), public domain, via Wikimedia Commons. Public domainResized and framed for display.

NOVEMBER 3, 2026

Election results

Unofficial results · Statewide totals · captured Nov 7, 1:22 AM CST

Votes
784,869
Share of reported selections
55.0%
Counties where Andy Barr had the most votes
117 of 120
U.S. Senate · sorted by votes
CandidateVotesShare
Andy BarrRepublican
784,86955.0%
Charles BookerDemocratic
612,35742.9%
Christopher CampbellKentucky Party
29,8922.1%
Write-in votes1520.0%

Unofficial until certified. Shares are of all reported selections in this race, including write-ins.

Andy Barr’s results in all 120 counties
Andy Barr, U.S. Senate, by county
CountyVotesShareMost votes
Adair County4,72479.5%Yes
Allen County3,99875.2%Yes
Anderson County6,17066.0%Yes
Ballard County2,01475.0%Yes
Barren County7,90866.0%Yes
Bath County2,55964.7%Yes
Bell County4,30275.7%Yes
Boone County26,05758.9%Yes
Bourbon County4,04058.6%Yes
Boyd County7,06556.7%Yes
Boyle County5,62754.7%Yes
Bracken County2,03170.9%Yes
Breathitt County2,24663.7%Yes
Breckinridge County4,63971.0%Yes
Bullitt County17,73766.3%Yes
Butler County3,09076.6%Yes
Caldwell County2,97171.7%Yes
Calloway County7,14760.6%Yes
Campbell County17,37649.7%Yes
Carlisle County1,30776.9%Yes
Carroll County1,89263.3%Yes
Carter County4,67965.6%Yes
Casey County3,52481.9%Yes
Christian County7,82857.7%Yes
Clark County7,59858.9%Yes
Clay County3,75783.4%Yes
Clinton County2,55782.7%Yes
Crittenden County2,26579.3%Yes
Cumberland County1,56178.5%Yes
Daviess County17,40855.1%Yes
Edmonson County2,60372.6%Yes
Elliott County1,19766.7%Yes
Estill County3,29872.8%Yes
Fayette County37,94633.5%
Fleming County3,38571.6%Yes
Floyd County6,97863.6%Yes
Franklin County8,56342.9%
Fulton County1,06364.4%Yes
Gallatin County1,86970.1%Yes
Garrard County4,05471.5%Yes
Grant County4,74872.4%Yes
Graves County7,53272.2%Yes
Grayson County5,05572.1%Yes
Green County3,01379.5%Yes
Greenup County6,74064.4%Yes
Hancock County2,27165.1%Yes
Hardin County18,29355.2%Yes
Harlan County4,54878.6%Yes
Harrison County4,16765.4%Yes
Hart County3,51468.3%Yes
Henderson County7,74557.3%Yes
Henry County3,45766.4%Yes
Hickman County1,01975.3%Yes
Hopkins County8,71464.8%Yes
Jackson County3,04383.0%Yes
Jefferson County88,65633.5%
Jessamine County11,29559.5%Yes
Johnson County4,26175.7%Yes
Kenton County27,52949.9%Yes
Knott County3,01267.2%Yes
Knox County5,27275.8%Yes
Larue County3,47371.7%Yes
Laurel County12,02275.9%Yes
Lawrence County2,62272.4%Yes
Lee County1,43677.1%Yes
Leslie County1,85983.8%Yes
Letcher County3,75467.0%Yes
Lewis County2,33775.2%Yes
Lincoln County4,76870.7%Yes
Livingston County2,64476.9%Yes
Logan County5,80467.9%Yes
Lyon County2,02069.7%Yes
Madison County17,02054.1%Yes
Magoffin County2,87368.1%Yes
Marion County3,85960.1%Yes
Marshall County8,30871.2%Yes
Martin County2,00082.9%Yes
Mason County3,54562.2%Yes
McCracken County12,84259.8%Yes
McCreary County3,21681.7%Yes
McLean County2,33271.2%Yes
Meade County5,97866.4%Yes
Menifee County1,68367.6%Yes
Mercer County5,32163.4%Yes
Metcalfe County2,67872.0%Yes
Monroe County2,75284.4%Yes
Montgomery County5,51363.8%Yes
Morgan County2,70369.0%Yes
Muhlenberg County5,99866.9%Yes
Nelson County9,87561.0%Yes
Nicholas County1,86968.5%Yes
Ohio County4,72972.1%Yes
Oldham County15,18954.6%Yes
Owen County2,64071.2%Yes
Owsley County1,23881.7%Yes
Pendleton County3,16472.5%Yes
Perry County4,95567.6%Yes
Pike County10,01969.6%Yes
Powell County2,80666.9%Yes
Pulaski County14,67774.6%Yes
Robertson County61869.2%Yes
Rockcastle County3,39578.9%Yes
Rowan County3,29449.7%Yes
Russell County4,71080.5%Yes
Scott County11,02352.2%Yes
Shelby County10,77559.7%Yes
Simpson County3,29662.2%Yes
Spencer County5,15570.3%Yes
Taylor County5,94672.2%Yes
Todd County2,24269.7%Yes
Trigg County3,32369.5%Yes
Trimble County2,06569.2%Yes
Union County2,73669.7%Yes
Warren County19,30751.0%Yes
Washington County3,15566.3%Yes
Wayne County4,04673.9%Yes
Webster County2,44870.2%Yes
Whitley County6,26675.8%Yes
Wolfe County1,34759.7%Yes
Woodford County6,28451.4%Yes

FOLLOW THE MONEY

Campaign finances

Federal campaign totals reported to the FEC.

Checked

Money received
$12,541,350.16

–

Total receipts, including contributions and other income.

Money spent
$14,680,570.70

–

Total disbursements, including operating costs and other payments.

Cash available
$1,553,857.10

As of

Cash on hand at the end of the reporting period.

Debts & loans
$0.00

As of

Amount the campaign committees owe.

View the FEC source Full-election aggregate
What’s included?

These are candidate-wide totals, not money raised or spent only in Paducah or McCracken County.

FEC lists these authorized committees for this candidate. Their figures are combined in the summary; do not add their totals again.

Check the dates beside each figure. Reporting periods and aggregation settings differ between candidates, so these snapshots are not a fundraising ranking.

Reports may be revised. Independent spending is not included. The check time tells you when we captured the FEC page, not when a campaign filed its report.

About Andy Barr

Background

  • The U.S. House lists Barr as Kentucky’s 6th District representative. His congressional biography records service beginning in 2013. [1][2]
  • His congressional biography lists a University of Virginia bachelor’s degree in government and philosophy in 1996 and a University of Kentucky law degree in 2001. [2]

We have not verified enough current campaign material for a priorities summary.

Summary reviewed October 25, 2026. Campaign statements are attributed to their sources.

THE OFFICE

What a U.S. senator does

  • Kentucky elects two U.S. senators, each for a six-year term. [1]
  • The Senate and the House of Representatives together make up Congress, which holds the federal government's lawmaking power. [1]
  • The president's nominees for ambassador, the Supreme Court and other offices need the Senate's consent, and a treaty needs the approval of two-thirds of the senators present. [1]
  • The Senate alone tries impeachments; conviction takes two-thirds of the members present. [1]
  1. U.S. Constitution, Articles I and II (U.S. Senate) Checked

Sources

Biography statements cite their sources inline. Campaign-finance records link to the filing agency. The portrait’s credit is under the photo. ProPaducah does not endorse candidates.

Share the evidence

Share this chart

Download full chart (PNG)

Your comment stays in this browser tab. Copy it below, then paste it into Facebook’s composer.

Continue to Facebook →

The link opens this chart with its year, definitions and source. You choose what to post in Facebook.

Privacy settings

Essential storage remembers this choice and supports the site. It is always available.

This choice does not sign you up for a newsletter or give permission for marketing email. More about privacy